 Prof. J.P.N. Mishra
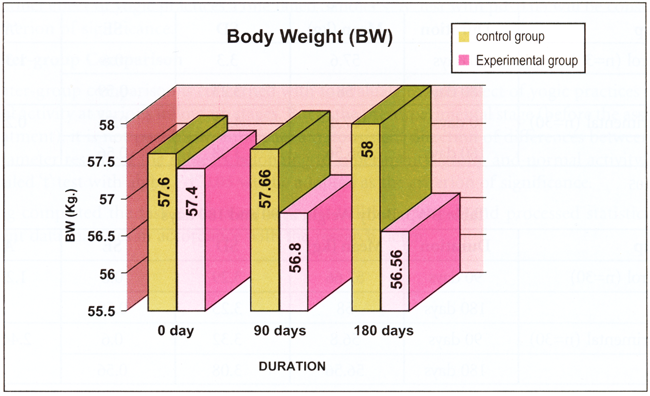
While comparing the changes in body weight in between control and experimental groups at different schedules of observations it was noticed that the mean values of body weight of experimental group of subjects were continuously but insignificantly reduced in the 1st and 2nd follow-up phases. But in control group of subjects it was increased slightly after three months of intervention followed by another insignificant increase after 180 days. (Table BW4; Fig. R1.)
Table BW4: Comparison in the Body Weight at different follow-up periods
| Group | Duration | Mean (kg) | SD | SE | 't' |
| Control (n=30) | 0 day | 57.6 | 3.3 | .6 | 0.2 NS |
| Experimental (n=30) | 0 day | 57.4 | 4.21 | 0.76 | |
| Control (n=30) | 90 days | 57.66 | 3.29 | 0.6 | 1.1NS |
| Experimental (n=30) | 90 days | 56.8 | 3.32 | 0.6 | |
| Control (n=30) | 180 days | 58 | 3.23 | 0.59 | 1.7NS |
| Experimental (n=30) | 180 days | 56.56 | 3.08 | 0.56 |
Fig. R1. Comparative values of body weight of control and experimental group of subjects at various schedules of observations.