 Prof. J.P.N. Mishra
The mean values of heart rate of experimental group was 72.408 ± 9.368 beats/minute (Table HR1) and that of control group was recorded to be 72.521 ± 9.34 beats/minute at 0 day. A significant change was noticed in experimental group after 2 months of yoga and preksha meditation intervention, but no such significant difference was noticed in control group (Table HR2).
Table HR1: Experimental Group (n= 100)
| Duration | Mean (B/M) | SD | SE | 'A' |
| 0D | 72.408 | 9.368 | 1.111 | 0.261** |
| 2M | 71.746 | 7.486 | 0.888 | |
| 0D | 72.408 | 9.368 | 1.111 | 0.128*** |
| 6M | 70.985 | 5.782 | 0.686 | |
| 0D | 72.408 | 9.368 | 1.111 | 0.054*** |
| 12M | 69.662 | 5.016 | 0.595 | |
| 2M | 71.746 | 7.486 | 0.888 | 0.126*** |
| 6M | 70.985 | 5.782 | 0.686 | |
| 2M | 71.746 | 7.486 | 0.888 | 0.042*** |
| 12M | 69.662 | 5.016 | 0.595 | |
| 6M | 70.985 | 5.782 | 0.686 | 0.027*** |
| 12M | 69.662 | 5.016 | 0.595 |
Table HR2: Control Group (n=100)
| Duration | Mean (B/M) | SD | SE | 'A' |
| 0D | 72.521 | 9.34 | 1.108 | 0.5NS |
| 2M | 72.464 | 9.316 | 1.105 | |
| 0D | 72.521 | 9.34 | 1.108 | 0.5NS |
| 6M | 72.436 | 9.317 | 1.105 | |
| 0D | 72.521 | 9.34 | 1.108 | 0.5312NS |
| 12M | 72.408 | 9.335 | 1.107 | |
| 2M | 72.464 | 9.316 | 1.105 | 1.5NS |
| 6M | 72.436 | 9.317 | 1.105 | |
| 2M | 72.464 | 9.316 | 1.105 | 1.375NS |
| 12M | 72.408 | 9.335 | 1.107 | |
| 6M | 72.436 | 9.317 | 1.105 | 1.5NS |
| 12M | 72.408 | 9.335 | 1.107 |
The 12 months practice of yoga and preksha meditation imparted a wide impact on experimental group. The Table 1 and 2 reveals the mean SD and Y values of subjects of both groups. It indicates that subjects of experimental group have got reduced their heart rate at a high level of significance. When mean values of heart rate of control and experimental group compared at post intervention 2, 6 and 12 months, only experimental group shows a statistically significant reduction at each post intervention schedules of observation. (Table HR1).
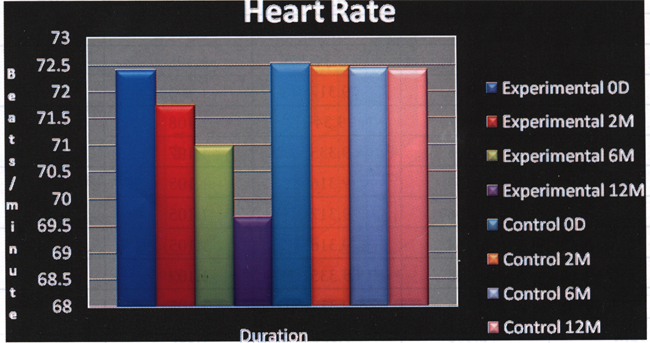
Heart rate of both groups was almost in similar range at onset of experiment without any significant difference thus showing homogeneity in between the subjects of both the group. The value of heart rate in experimental group of subjects was reduced significantly (p <0.01) when compared with that of control group after 12 months. But no such difference was noticed when the values of heart rate of both the group were compared after 2 and 6 months of experimental intervention (Table 3- Fig. R2).
Table HR3: Inter-group comparison of heart rate for experimental and control group of subjects.
| Group | Duration | Mean (B/M) | SD | SE | 't' |
| Experimental | 0D | 72.408 | 9.368 | 1.111 | -0.089NS |
| Control | 0D | 72.521 | 9.340 | 1.108 | |
| Experimental | 2M | 71.746 | 7.486 | 0.888 | -0.653NS |
| Control | 2M | 72.464 | 9.316 | 1.105 | |
| Experimental | 6M | 70.985 | 5.782 | 0.686 | -1.371NS |
| Control | 6M | 72.436 | 9.317 | 1.105 | |
| Experimental | 12M | 69.662 | 5.016 | 0.595 | -2.622* |
| Control | 12M | 72.408 | 9.335 | 1.107 |
Fig. R2: Comparison of heart rate at different follow-up periods in control and experimental subjects