 Prof. J.P.N. Mishra
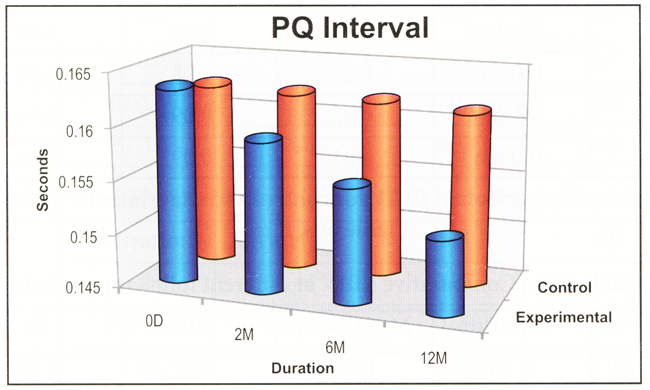
The basal mean values of PQ interval in control and experimental group were 0.1622 ±.01281 and 0.1636 ±.01271 sec. respectively. After 2, 6 and 12 months of experiment, a decrease in the PQ interval was noticed in the experimental group of subjects, the values being 0.1592 ±.01058, 0.1556.00963 and 0.1517 ±.0152sec. respectively. The differences were statistically significant (P < 0.0005 and P < 0.0005). However, in the control group the PQ interval at 2,6 and 12 months were 0.1619 ±.01241, 0.1617 ±.01267 and 0.1616 ±.01335, which were not statistically significant.
Table E 20: Experimental group
| Duration | Mean (sec.) | SD | SE | 'A' |
| 0D | 0.163 | 0.012 | 0.0015 | 0.031*** |
| 2M | 0.159 | 0.010 | 0.0012 | |
| 0D | 0.163 | 0.012 | 0.0015 | 0.040*** |
| 6M | 0.155 | 0.009 | 0.0011 | |
| 0D | 0.163 | 0.012 | 0.0015 | 0.051*** |
| 12M | 0.151 | 0.015 | 0.0017 | |
| 2M | 0.159 | 0.010 | 0.0012 | 0.106*** |
| 6M | 0.155 | 0.009 | 0.0011 | |
| 2M | 0.159 | 0.010 | 0.0012 | 0.096*** |
| 12M | 0.151 | 0.015 | 0.0017 | |
| 6M | 0.155 | 0.009 | 0.0011 | 0.089*** |
| 12M | 0.151 | 0.015 | 0.0017 |
Table E 21: Control group
| Duration | Mean (sec.) | SD | SE | 'A' |
| 0D | 0.162 | 0.0128 | 0.0015 | 0.501 NS |
| 2M | 0.161 | 0.0124 | 0.0014 | |
| 0D | 0.162 | 0.0128 | 0.0015 | 0.513 NS |
| 6M | 0.161 | 0.0126 | 0.0014 | |
| 0D | 0.162 | 0.0128 | 0.0015 | 0.532 NS |
| 12M | 0.161 | 0.0133 | 0.0015 | |
| 2M | 0.161 | 0.0124 | 0.0014 | o.949 ns |
| 6M | 0.161 | 0.0126 | 0.0014 | |
| 2M | 0.161 | 0.0124 | 0.0014 | 0.507 Ns |
| 12M | 0.161 | 0.0133 | 0.0015 | |
| 6M | 0.161 | 0.0126 | 0.0014 | 1.041*** |
| 12M | 0.161 | 0.0133 | 0.0015 |
Table E 22: Inter-group comparison of PQ interval at different follow-up periods in control and experimental subjects.
| Group | Duration | Mean (sec.) | SD | SE | 't' |
| Experimental | 0D | 0.163 | 0.0127 | 0.0015 | 0.585 NS |
| Control | 0D | 0.162 | 0.0128 | 0.0015 | |
| Experimental | 2M | 0.159 | 0.0105 | 0.0012 | -1.356 NS |
| Control | 2M | 0.161 | 0.0124 | 0.0014 | |
| Experimental | 6M | 0.155 | 0.0096 | 0.0011 | -2.-938* |
| Control | 6M | 0.161 | 0.0126 | 0.0014 | |
| Experimental | 12M | 0.151 | 0.0152 | 0.0017 | -3.737# |
| Control | 12M | 0.161 | 0.0133 | 0.0015 |
When compared with initial stages, PQ interval decreases in experimental group of subjects, which was not decreased in control group of subjects after yoga and preksha meditation practice. This reduction was statistically significant when compared with control group of subjects at different follow-up stages (Table E 22; Fig. 11).
Fig. R 11: Comparison of PQ interval at different follow-up periods in control and experimental subjects