 Prof. J.P.N. Mishra
The mean value of total serum cholesterol in control group of subjects was found to be 181.9412 ± 6.34341 mg/dl, where as in experimental group of subjects it was 183.0000 ± 5.07519 mg/dl (Table CI). After 90 days of experimental intervention the total cholesterol in experimental group was reduced to 180.6471 ± 4.76020 mg/dl. This difference was statistically significant (p < 0.0005). However in control group of subjects no such reduction was noticed (Table C1).
Table C1: Intra-group comparison of total cholesterol levels of control and experimental group of subjects after 90 days follow-up duration.
| Group | Duration | Mean(mg/dl) | SD | SE | 'A' |
| Control | 0 day | 181.9412 | 6.34341 | 1.08789 | 10.25 |
| 90 days | 182.1765 | 4.35869 | 0.74751 | ||
| Experimental | 0 day | 183.0000 | 5.07519 | 0.87039 | 0.0506*** |
| 90 days | 180.6471 | 4.76020 | 0.81637 |
A regular and significant decline in total cholesterol level was noticed in experimental group after 180 days and the values were found to be 179.2941 ± 4.60914 mg/dl (Fig. R4). This trend of reduction continued even at 90 and 180 days. But in control group no such significant decline was noticed at both follow-up stages (Table C2 and C3).
Table C2: Intra-group comparison of total cholesterol levels of control and experimental group of subjects after 180 days follow-up duration.
| Group | Duration | Mean (mg/dl) | SD | SE | 'A' |
| Control | 0 day | 181.9412 | 6.34341 | 1.08789 | 0.558 |
| 180 days | 183.0000 | 5.07519 | 0.87039 | ||
| Experimental | 0 day | 183.0000 | 5.07519 | 0.87039 | 0.0417*** |
| 180 days | 179.2941 | 4.60914 | 0.79046 |
Table C3: Intra-group comparative values of total cholesterol at 1st follow-up (90 days) and 2nd follow-up (180 days) in control and experimental group of subjects.
| Group | Duration | Mean(mg/dl) | SD | SE | 'A' |
| Control | 90 day | 182.1765 | 4.35869 | 0.74751 | 0.566 |
| 180 days | 183.0000 | 5.07519 | 0.87039 | ||
| Experimental | 90 day | 180.6471 | 4.76020 | 0.81637 | 0.0101*** |
| 180 days | 179.2941 | 4.60914 | 0.79046 |
When the mean values of total cholesterol of both control and experimental groups were compared at different stages of experiment, no significant difference was found at onset (0 day) of experiment but the difference in the total cholesterol level between control group and experimental group was significant at 90 and 180 days (p < 0.023 and p < 0.001 respectively) (Table C4).
Fig. R14: Comparison of total cholesterol levels of control and experimental group of subjects at various follow-up stages.
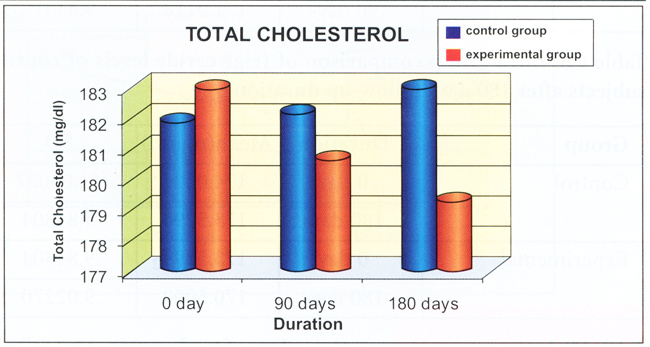
Table C4: Comparative values of total cholesterol at different follow-up periods in control and experimental subjects.
| Group | Duration | Mean(mg/dl) | SD | SE | 't' |
| Control | 0 day | 181.9412 | 6.34341 | 1.08789 | -1.354 |
| Experimental | 0 days | 183.0000 | 5.07519 | 0.87039 | |
| Control | 90 day | 182.1765 | 4.35869 | 0.74751 | 2.393* |
| Experimental | 90 days | 180.6471 | 4.76020 | 0.81637 | |
| Control | 180 day | 183.0000 | 5.07519 | 0.87039 | 8.888## |
| Experimental | 180 days | 179.2941 | 4.60914 | 0.79046 |