 Prof. J.P.N. Mishra
Mean PIFR in control group of subjects was found to be 5.1234 ± 1,47863 L/sec, whereas in experimental group of subjects it was 5.1731 ± 1,48193 L/sec, at the onset of experiment. After three months of prescribed practice module the PIFR was increased significantly to 6,0728 ± 1,42495 L/sec. in experimental group of subjects, while it was found to be on lower side in control group (5.1963 ± 1.48122 L/sec.). The difference in experimental group was statistically significant (P < 0.0005) as shown in Table R 7. A regular increase in PIFR was noticed in experimental group after 6 and 12 months of experiment and the value was found to be 7.7868 ± 1.45054 and 6.9896 ± 1.42481 L/sec. The change was statistically significant (P < 0.0005). However, the change in PIFR of control group of subjects was not significant (Table 38).
Table R 7: Experimental group
| Duration | Mean (sec.) | SD | SE | 'A' |
| 0D | 5.173 | 1.481 | 0.175 | 0.015*** |
| 2M | 6.072 | 1.424 | 0.169 | |
| 0D | 5.173 | 1.481 | 0.175 | 0.014*** |
| 6M | 6.989 | 1.424 | 0.169 | |
| 0D | 5.173 | 1.481 | 0.175 | 0.149*** |
| 12M | 7.786 | 1.450 | 0.172 | |
| 2M | 6.072 | 1.424 | 0.169 | 0.014*** |
| 6M | 6.989 | 1.424 | 0.169 | |
| 2M | 6.072 | 1.424 | 0.169 | 0.014*** |
| 12M | 7.786 | 1.450 | 0.172 | |
| 6M | 6.989 | 1.424 | 0.169 | 0.015*** |
| 12M | 7.786 | 1.450 | 0.172 |
Table R 8: Control group
| Duration | Mean (sec.) | SD | SE | 'A' |
| 0D | 5.123 | 1.478 | 0.175 | 0.411 NS |
| 2M | 5.196 | 1.481 | 0.175 | |
| 0D | 5.123 | 1.478 | 0.175 | 0.422 NS |
| 6M | 5.267 | 1.526 | 0.181 | |
| 0D | 5.123 | 1.478 | 0.175 | 0.403 NS |
| 12M | 5.324 | 1.600 | 0.189 | |
| 2M | 5.196 | 1.481 | 0.175 | 0.45 NS |
| 6M | 5.267 | 1.526 | 0.181 | |
| 2M | 5.196 | 1.481 | 0.175 | 0.65 NS |
| 12M | 5.324 | 1.600 | 0.189 | |
| 6M | 5.267 | 1.526 | 0.181 | 0.557 NS |
| 12M | 5.324 | 1.600 | 0.189 |
Table R 9: Inter-group comparison of PIFR at different follow-up periods in control and experimental subjects.
| Group | Duration | Mean (sec.) | SD | SE | 't' |
| Experimental | 0D | 5.173 | 1.481 | 0.175 | 0.424 NS |
| Control | 0D | 5.123 | 1.478 | 0.175 | |
| Experimental | 2M | 6.072 | 1.424 | 0.169 | 7.352# |
| Control | 2M | 5.196 | 1.481 | 0.175 | |
| Experimental | 6M | 6.989 | 1.424 | 0.169 | 12.685## |
| Control | 6M | 5.267 | 1.526 | 0.181 | |
| Experimental | 12M | 7.786 | 1.450 | 0.172 | 14.849## |
| Control | 12M | 5.324 | 1.6 | 0.189 |
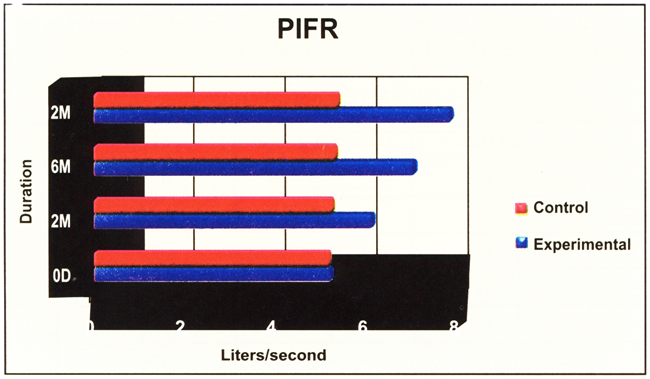
The basal mean values of PIFR of both the group of subjects, at the beginning of experiment, were in similar range 5.1234 ± 1.47863 L/sec and 5.1731 ± 1.48193 L/sec without any significant difference in between them. But significant difference (P d" 0.0005) was observed when the mean values of control group at 2, 6 and 12 months (Fig. 13) (5.1963 ± 1.48122, 5.2675 ± 1.52678 and 5.3244 ± 1.60046 L/sec) were compared with the same of experimental group (6.0728 ± 1.42495, 7.7868 ± 1.45054 and 6.9896 ± 1.42481) (Table R 9).
Fig. R 25: Comp prison of PIFR at different follow-up periods in control and experimental subjects