 Prof. J.P.N. Mishra
The basal values of FEV in control and experimental groups were 2.9572 ±.59009 L and 2.9739 ±.56955 L respectively. After 90 and 180 days of experiment, an increase in the FEV was noticed in the experimental group of subjects (i.e. 3.2797 ±.55619, 3.6362 ±.61230 and 3.9399 ±.80879 L respectively). The increase was statistically significant (P < 0.0005 and P d" 0.0005). However, in the control group of subjects no significant change in FEV was noticed at either of the follow-up schedules (Table R 13 and R 14).
Table R 13: Experimental group
| Duration | Mean (sec.) | SD | SE | 'A' |
| 0D | 2.973 | 0-569 | 0.067 | 0.024*** |
| 2M | 3.279 | 0.556 | 0.066 | |
| 0D | 2.973 | 0.569 | 0.067 | 0.015*** |
| 6M | 3.636 | 0.612 | 0.072 | |
| 0D | 2.973 | 0.569 | 0.067 | 0.023*** |
| 12M | 3.939 | 0.808 | 0.095 | |
| 2M | 3.279 | 0.556 | 0.066 | 0.02*** |
| 6M | 3.636 | 0.612 | 0.072 | |
| 2M | 3.279 | 0.556 | 0.066 | 0.017*** |
| 12M | 3.939 | 0.808 | 0.095 | |
| 6M | 3.636 | 0.612 | 0.072 | 0.026*** |
| 12M | 3.939 | 0.808 | 0.095 |
Table R 14: Control group
| Duration | Mean (sec.) | SD | SE | 'A' |
| 0D | 2.957 | 0.59 | 0.07 | 0.046 NS |
| 2M | 2.978 | 0.598 | 0.07 | |
| 0D | 2.957 | 0.59 | 0.07 | 0.806 NS |
| 6M | 3.008 | 0.625 | 0.074 | |
| 0D | 2.957 | 0.59 | 0.07 | 0.410 NS |
| 12M | 3.030 | 0.671 | 0.079 | |
| 2M | 2.978 | 0.598 | 0.07 | 0.632 NS |
| 6M | 3.008 | 0.625 | 0.074 | |
| 2M | 2.978 | 0.598 | 0.07 | 0.790 Ns |
| 12M | 3.030 | 0.671 | 0.079 | |
| 6M | 3.008 | 0.625 | 0.074 | 0.826 NS |
| 12M | 3.03 | 0.671 | 0.079 |
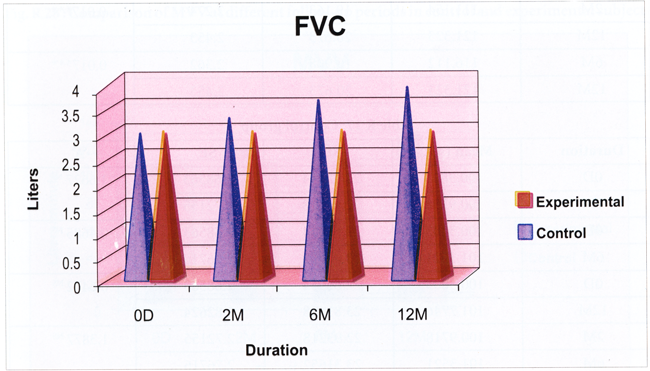
FEV was found to be improved in experimental group of subjects practicing yoga and preksha meditation. This improvement was statistically significant when compared with control group of subjects at different follow-up stages (Table R 15; Fig. R 27).
Table R 15: Inter-group comparison of FEV at different follow-up periods in control and experimental subjects.
| Group | Duration | Mean (sec.) | SD | SE | 't' |
| Experimental | 0D | 2.973 | 0.569 | 0.067 | 0.358 NS |
| Control | 0D | 2.957 | 0.59 | 0.07 | |
| Experimental | 2M | 3.279 | 0.556 | 0.066 | 5.777# |
| Control | 2M | 2.978 | 0.598 | 0.07 | |
| Experimental | 6M | 3.636 | 0.612 | 0.072 | 8.820## |
| Control | 6M | 3.008 | 0.625 | 0.074 | |
| Experimental | 12M | 3.939 | 0.808 | 0.095 | 8.964## |
| Control | 12M | 3.03 | 0.671 | 0.079 |
Fig. R 27: Comparison of FVC at different follow-up periods in control and experimental subjects