 Prof. J.P.N. Mishra
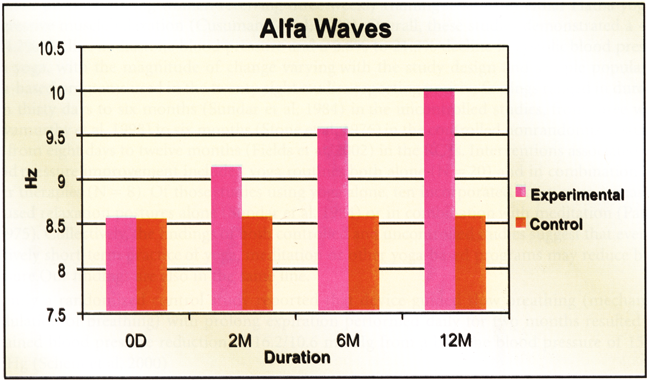
The mean basal value of alpha waves in control group of subjects was found to be 8.5486 ±.44532 htz. and in experimental group of subjects it was 8.5556 ±.44051. After 2 months of experimental intervention the number of alpha waves were increased to 9.1250 ±.62658 htz. in experimental group of subjects, while it remained almost same in control group and found to be 8.5694 ±.46953 htz.. The sustained significant enhancement was observed in 2nd and 3rd follow-up periods in experimental group of subjects. This difference was statistically significant (P < 0.0005 and P < 0.0005 respectively) as shown in Table M 4 and M 5; Fig. R 32.
Table M 4: Experimental group
| Duration | Mean (sec.) | SD | SE | 'A' |
| 0D | 8.555 | 0.44 | 0.051 | 0.022*** |
| 2M | 9.125 | 0.626 | 0.073 | |
| 0D | 8.555 | 0.44 | 0.051 | 0.016*** |
| 6M | 9.555 | 0.553 | 0.065 | |
| 0D | 8.555 | 0.44 | 0.051 | 0.016*** |
| 12M | 9.986 | 0.638 | 0.075 | |
| 2M | 9.125 | 0.626 | 0.073 | 0.02*** |
| 6M | 9.555 | 0.553 | 0.065 | |
| 2M | 9.125 | 0.626 | 0.073 | 0.02*** |
| 12M | 9.986 | 0.638 | 0.075 | |
| 6M | 9.555 | 0.553 | 0.065 | 0.02*** |
| 12M | 9.986 | 0.638 | 0.075 |
Table M 5: Control group
| Duration | Mean (sec.) | SD | SE | 'A' |
| 0D | 8.548 | 0.445 | 0.052 | 2 NS |
| 2M | 8.569 | 0.469 | 0.055 | |
| 0D | 8.548 | 0.445 | 0.052 | 5.5 NS |
| 6M | 8.569 | 0.519 | 0.061 | |
| 0D | 8.548 | 0.445 | 0.052 | 8 NS |
| 12M | 8.569 | 0.552 | 0.065 | |
| 2M | 8.569 | 0.469 | 0.055 | 5 NS |
| 6M | 8.569 | 0.519 | 0.061 | |
| 2M | 8.569 | 0.469 | 0.055 | 3 NS |
| 12M | 8.569 | 0.552 | 0.065 | |
| 6M | 8.569 | 0.519 | 0.061 | 2.5 NS |
| 12M | 8.569 | 0.552 | 0.065 |
A regular increase in alpha waves was noticed in experimental group of subjects after 6 months of yoga and preksha meditation practice and the value was found to be 9.5556 ±.55383. The change was statistically significant (P < 0.0005). However in control group no such change was noticed. Yoga and preksha meditation works on increase in alpha waves of the practitioners as the alpha waves of experimental group was further increased after 12 months of experimental intervention.
Table M 6: Inter-group comparison of Alfa waves at different follow-up periods in control and experimental subjects.
| Group | Duration | Mean (sec.) | SD | SE | 't' |
| Experimental | 0D | 8.555 | 0.44 | 0.051 | 1NS |
| Control | 0D | 8.548 | 0.445 | 0.052 | |
| Experimental | 2M | 9.125 | 0.626 | 0.073 | 10# |
| Control | 2M | 8.569 | 0.469 | 0.055 | |
| Experimental | 6M | 9.555 | 0.553 | 0.065 | 15.037## |
| Control | 6M | 8.569 | 0.519 | 0.061 | |
| Experimental | 12M | 9.986 | 0.638 | 0.075 | 15.723## |
| Control | 12M | 8.569 | 0.552 | 0.065 |
The mean values of alpha waves of both the groups at the beginning of the experiment were in similar range (8.5486 ±.44532 and 8.5556 ±.44051 htz.) without any significant difference between them. But a significant difference (P10.05) was observed when the mean values of control group at 180 days were compared with that of experimental group (Table M 6; Fig. R 32).
Fig. R 32: Comparison of Alfa waves at different follow-up periods in control and experimental subjects