 Prof. J.P.N. Mishra
At the onset of the experiment the mean systolic blood pressure of the experimental group of subjects was 117.591 ± 7.423 mmHg and it was reduced to 114.845 ± 5.768 mmHg after 2 months of yogic practice. This change was statistically significant at p < 0.0005 level (Table BP 2). After 6 and 12 months of the yogic module practice the mean systolic blood pressure of experimental group further reduced to 113.281 ± 4.356 mmHg and 111.901 ± 3.304 as compared to the initial value showing statistical significance (p < 0.0005). But in control group of subjects the systolic blood pressure remains in the same range (Table BP 1) (Fig 2). The similar changes were noticed when the values at 6 months were compared with that of 12 months (Table BP 1).
Table BP 1: Experimental Group (n = 100)
| Duration | Mean (mmHg) | SD | SE | 'A' |
| 0D | 117.591 | 7.423 | 0.88 | 0.034*** |
| 2M | 114.845 | 5.768 | 0.684 | |
| 0D | 117.591 | 7.423 | 0.88 | 0.03*** |
| 6M | 113.281 | 4.356 | 0.516 | |
| 0D | 117.591 | 7.423 | 0.880 | 0.025*** |
| 12M | 111.901 | 3.304 | 0.392 | |
| 2M | 114.845 | 5.768 | 0.684 | 0.056*** |
| 6M | 113.281 | 4.356 | 0.516 | |
| 2M | 114.845 | 5.768 | 0.684 | 0.034*** |
| 12M | 111.901 | 3.304 | 0.392 | |
| 6M | 113.281 | 4.356 | 0.516 | 0.036*** |
| 12M | 111.901 | 3.304 | 0.392 |
SBP values in control group of subjects was 117.422 ± 7.511 mmHg at the onset which found to be 117.394 ± 7.459, 117.352 ± 7.525 and 117.309 ± 117.309 mmHg at 2, 6 and 12months respectively, showing statistical insignificance (Table BP 2).
When the values of four stages of observations in both the groups were compared with each other it was observed that at initial stage both groups have almost same SBP, without any significant difference. But after 1st and 2nd follow-up (2 and 6 months) a significant difference (p < 0.05) occurs and the mean value of experimental group reduced to 114.845 ± 5.768 mmHg and 113.281 ± 4.356 respectively (Table BP 3).
Table BP 2: Control Group (n=100)
| Duration | Mean (mmHg) | SD | SE | 'A' |
| 0D | 117.422 | 7.511 | 0.891 | 1NS |
| 2M | 117.394 | 7.459 | 0.885 | |
| 0D | 117.422 | 7.511 | 0.891 | 0.52 NS |
| 6M | 117.352 | 7.525 | 0.893 | |
| 0D | 117.422 | 7.511 | 0.891 | 0.656 NS |
| 12M | 117.309 | 7.309 | 0.889 | |
| 2M | 117.394 | 7.459 | 0.885 | 1.444 NS |
| 6M | 117.352 | 7.525 | 0.893 | |
| 2M | 117.394 | 7.459 | 0.885 | 0.5 NS |
| 12M | 117.309 | 7.497 | 0.889 | |
| 6M | 117.352 | 7.525 | 0.893 | 1.444 ns |
| 12M | 117.309 | 7.497 | 0.889 |
Fig. R 3: Comparison of systolic blood pressure at different follow-up periods in control and experimental subjects
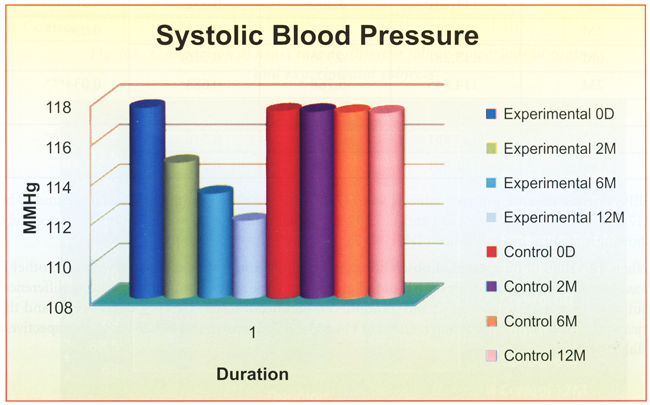
Table BP 3: Inter-group comparison of SBP for experimental and control group of subjects.
| Group | Duration | Mean (mmHg) | SD | SE | Y |
| Experimental | 0D | 117.591 | 7.423 | 0.88 | 0.133 NS |
| Control | 0D | 117.422 | 7.511 | 0.891 | |
| Experimental | 2M | 114.845 | 5.768 | 0.684 | -2.260# |
| Control | 2M | 117.394 | 7.459 | 0.885 | |
| Experimental | 6M | 113.281 | 4.356 | 0.516 | -3.832# |
| Control | 6M | 117.352 | 7.525 | 0.893 | |
| Experimental | 12M | 111.901 | 3.304 | 0.392 | -5.340## |
| Control | 12M | 117.309 | 7.497 | 0.889 |