 Prof. J.P.N. Mishra
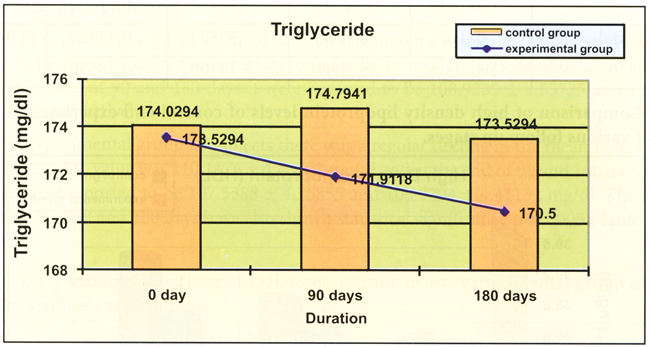
The control group of subjects has shown almost constant level of serum triglyceride during the different follow up periods, the mean values being 174.0294 ± 11.03022, 174.7941 ± 10.44112 and 173.5294 ± 9.84804 mg/dl. Contrary to that there was a regular decline in the triglyceride in experimental group of subjects at all follow-up periods. The mean serum triglyceride level in this group on 0 day was estimated to be 173.5294 ± 9.84804 mg/dl. However, at the subsequent follow- up periods, i.e. 90 and 180 days the mean values were 171.9118 ± 9.44319 and 170.5000 ± 9.02270 mg/dl respectively. The difference in the mean values between control and experimental group of subjects at 90 and 180 days were statistically significant (p < 0.0005). (Table No.C5, C6 and C7).
Table C5: Intra-group comparison of triglyceride levels of control and experimental group of subjects after 90 days follow-up duration.
| Group | Duration | Mean (mg/dl) | SD | SE | 'A' |
| Control | 0 day | 174.0294 | 11.03022 | 1.89167 | 0.727 |
| 90 days | 174.7941 | 10.44112 | 1.79064 | ||
| Experimental | 0 day | 173.5294 | 9.84804 | 1.68893 | 0.0928*** |
| 90 days | 171.9118 | 9.44319 | 1.61949 |
Table C6: Intra-group comparison of triglyceride levels of control and experimental group of subjects after 180 days follow-up duration.
| Group | Duration | Mean(mg/dl) | SD | SE | 'A' |
| Control | 0 day | 174.0294 | 11.03022 | 1.89167 | 2.674 |
| 180 days | 173.5294 | 9.84804 | L68893 | ||
| Experimental | 0 day | 173.5294 | 9.84804 | 1.68893 | 0.0451*** |
| 180 days | 170.5000 | 9.02270 | 1.54738 |
Table C7: Intra-group comparative values of triglyceride at 1st follow-up (90 days) and 2nd follow- up (180 days) in control and experimental group of subjects.
| Group | Duration | Mean(mg/dl) | SD | SE | A' |
| Control | 90 day | 174.7941 | 10.44112 | 1.79064 | 0.417 |
| 180 days | 173.5294 | 9.84804 | 1.68893 | ||
| Experimental | 90 day | 171.9118 | 9.44319 | 1.61949 | 0.0789*** |
| 180 days | 170.5000 | 9.02270 | 1.54738 |
The values of triglyceride of both the groups i.e. control and experimental group of subjects at the beginning of the experiment were found to be in similar range (174.0294 ±11.03022 and 173.5294 ± 9.44319) without any significant difference. But after 90 and 180 days a significant decline was noticed in experimental group, in comparison to control group, as depicted in Table C8.
Table C8: Comparative values of triglyceride at different follow-up periods in control and experimental subjects.
| Group | Duration | Mean(mg/dl) | SD | SE | 't' |
| Control | 0 day | 174.0294 | 11.03022 | 1.89167 | 0.606 |
| Experimental | 0 days | 173.5294 | 9.84804 | 1.68893 | |
| Control | 90 day | 174.7941 | 10.44112 | 1.79064 | 4.725## |
| Experimental | 90 days | 171.9118 | 9.44319 | 1.61949 | |
| Control | 180 day | 173.5294 | 9.84804 | 1.68893 | 7.853## |
| Experimental | 180 days | 170.5000 | 9.02270 | 1.54738 |
Fig. R15: Comparison of Triglyceride levels of control and experimental group of subjects at various follow-up stages.