 Prof. J.P.N. Mishra
The mean serum VLDL level in control group of subjects was estimated to be 34.8059 ± 2.20604,34.9588 ± 2.08822 and 34.7059 ± 1.96961 mg/dl at 0,90 and 180 days respectively. The mean serum VLDL values in experimental group of subjects were found to be 34.7059 ± 1.96961,34.3824 ± 1.88864 and 34.1000 ± 1.80454 mg/dl at 0, 90 and 180 days respectively, showing a significant decline (p£ 0.0005) only at 90 and 180 days when compared with the basal values at 0 day. When the values of VLDL of experimental group at 90 and 180 days were compared with each other the level of significance was much higher. (Table C17, C18 and C19).
Table R 18: Intra-group comparison of VLDL levels of control and experimental group of subjects after 90 days follow-up duration.
| Group | Duration | Mean(mg/dl) | SD | SE | 'A' |
| Control | 0 day | 34.8059 | 2.20604 | 0.37833 | 0.727 |
| 90 days | 34.9588 | 2.08822 | 0.35813 | ||
| Experimental | 0 day | 34.7059 | 1.96961 | 0.33779 | 0.0928*** |
| 90 days | 34.3824 | 1.88864 | 0.32390 |
Table C18: Intra-group comparison of VLDL levels of control and experimental group of subjects after 180 days follow-up duration.
| Group | Duration | Mean (mg/dl) | SD | SE | 'A' |
| Control | 0 day | 34.8059 | 2.20604 | 0.37833 | 2.674 |
| 180 days | 34.7059 | 1.96961 | 0.33779 | ||
| Experimental | 0 day | 34.7059 | 1.96961 | 0.33779 | 0.0452*** |
| 180 days | 34.1000 | 1.80454 | 0.30948 |
Fig. R18: Comparison of very low density lipoprotein levels of control and experimental group of subjects at various follow-up stages.
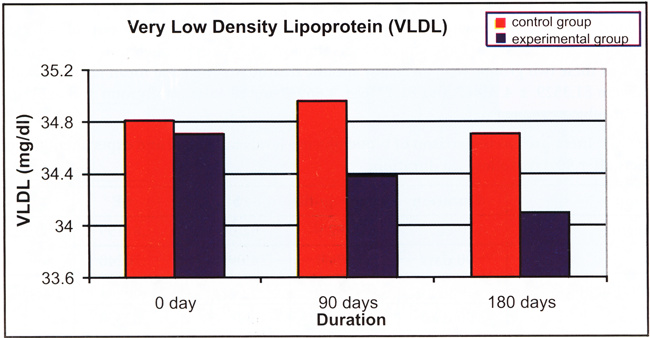
Table C19: Intra-group comparative values of VLDL at 1st follow-up (90 days) and 2nd follow-up (180 days) in control and experimental group of subjects.
| Group | Duration | Mean (mg/dl) | SD | SE | 'A' |
| Control | 90 day | 34.9588 | 2.08822 | 0.35813 | 0.657 |
| 180 days | 34.7059 | 1.96961 | 0.33779 | ||
| Experimental | 90 day | 34.3824 | 1.88864 | 0.32390 | 0.0789*** |
| 180 days | 34.1000 | 1.80454 | 0.30948 |
Mean values of VLDL of both experimental and control groups at various follow-up periods are given in Table C20. The result shows that the differences in the values of two groups were found to be significant at 90 and 180 days of follow-up period.
Table C20: Comparative values of VLDL at different follow-up periods in control and experimental subjects.
| Group | Duration | Mean (mg/dl) | SD | SE | 't' |
| Control | 0 day | 34.8059 | 2.20604 | 0.37833 | 0.606 |
| Experimental | 0 days | 34.7059 | 1.96961 | 0.33779 | |
| Control | 90 day | 34.9588 | 2.08822 | 0.35813 | 4.725** |
| Experimental | 90 days | 34.3824 | 1.88864 | 0.32390 | |
| Control | 180 day | 34.7059 | 1.96961 | 0.33779 | 7.853** |
| Experimental | 180 days | 34.1000 | 1.80454 | 0.30948 |
High Density Lipoprotein, Low Density Lipoprotein and Very Low Density Lipoprotein ratio had shown a significant change in terms of increased HDL level, decreased LDL and VLDL level. So the hypothesis number 8 is accepted.