 Prof. J.P.N. Mishra
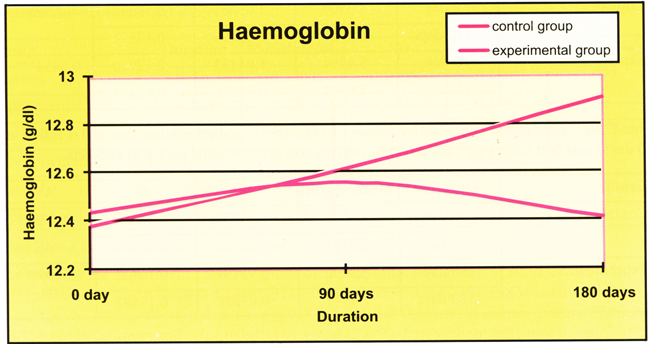
The basal values of hemoglobin in blood of both control and experimental group were 12.4412 ± 1.07847 gm/dl and 12.3824 ± 0.77907 gm/dl respectively. The mean value of hemoglobin in experimental group slightly increases during 1st follow up phase, but that was not statistically significant, but after 180 days of practice of Preksha Meditation the change in mean value was statistically significant. In control group of subjects the mean values remain almost in similar range and showed insignificance in the difference. The mean values of experimental group when compared at 90 and 180 days, showed a significant increase (Table C 25, C 26 and C 27).
Table C 25: Intra-group comparison of hemoglobin levels of control and experimental group of subjects after 90 days follow-up duration.
| Group | Duration | Mean (mg/dl) | SD | SE | 'A' |
| Control | 0 day | 12.4412 | 1.07847 | 0.18496 | 1.125 |
| 90 days | 12.5588 | 0.89413 | 0.15334 | ||
| Experimental | 0 day | 12.3824 | 0.95393 | 0.16360 | 0.3437* |
| 90 days | 12.6176 | 0.77907 | 0.13361 |
Table C 26: Intra-group comparison of hemoglobin levels of control and experimental group of subjects after 180 days follow-up duration.
| Group | Duration | Mean (mg/dl) | SD | SE | 'A' |
| Control | 0 day | 12.4412 | 1.07847 | 0.18496 | 11 |
| 180 days | 12.4118 | 0.98835 | 0.16950 | ||
| Experimental | 0 day | 12.3824 | 0.95393 | 0.16360 | 0.0741*** |
| 180 days | . 12.9118 | 0.86577 | 0.14848 |
Table C 27: Intra-group comparative values of hemoglobin at 1st follow-up (90 days) and 2nd follow-up (180 days) in control and experimental group of subjects.
| Group | Duration | Mean(mg/dl) | SD | SE | 'A' |
| Control | 90 day | 12.5588 | 0.89413 | 0.15334 | 6.68 |
| 180 days | 12.4118 | 0.98835 | 0.16950 | ||
| Experimental | 90 day | 12.6176 | 0.77907 | .0.13361 | 0.18# |
| 180 days | 12.9118 | 0.86577 | 0.14848 |
Inter group comparison of the mean values of hemoglobin in experimental and control group of subjects at different follow-up phases shown in Table H4. The significant change was observed at 2nd follow-up period (i.e. 180 days).
Table C 27: Comparative values of hemoglobin at different follow-up periods in control and experimental subjects.
| Group | Duration | Mean(mg/dl) | SD | SE | 't' |
| Control | 0 day | 12.4412 | 1.07847 | 0.18496 | 0.627 |
| Experimental | 0 days | 12.3824 | 0.95393 | 0.16360 | |
| Control | 90 day | 12.5588 | 0.89413 | 0.15334 | -0.627 |
| Experimental | 90 days | 12.6176 | 0.77907 | 0.13361 | |
| Control | 180 day | 12.4118 | 0.98835 | 0.16950 | -4.398** |
| Experimental | 180 days | 12.9118 | 0.86577 | 0.14848 |
Fig. R 20: Comparison of Hemoglobin levels of control and experimental group of subjects at various follow-up stages.
So the hypothesis no 9 is accepted.