 Prof. J.P.N. Mishra
The Table 52 & 53 reveals the mean ± SD EtC02 values of subjects of both control and experimental groups at 0, 2, 6 and 12 months. It indicates that there is a significant increase (P < 0.0005) in the EtC02 of experimental group of subjects after 6 and 12 months of yoga and preksha meditation practice. No such change was noticed in control group of subjects when we compared the mean values of EtC02 of 0 day with that of 6 and 12 months in them.
Table R 22: Experimental group
| Duration | Mean (sec.) | SD | SE | 'A' |
| 0D | 31.916 | 4.722 | 0.556 | 0.026*** |
| 2M | 33.402 | 4.461 | 0.525 | |
| 0D | 31.916 | 4.722 | 0.556 | 0.022*** |
| 6M | 35.180 | 4.270 | 0.503 | |
| 0D | 31.916 | 4.722 | 0.556 | 0.021*** |
| 12M | 37.097 | 4.535 | 0.534 | |
| 2M | 33.402 | 4.461 | 0.525 | 0.024*** |
| 6M | 35.180 | 4.270 | 0.503 | |
| 2M | 33.402 | 4.461 | 0.525 | 0.021*** |
| 12M | 37.097 | 4.535 | 0.534 | |
| 6M | 35.180 | 4.270 | 0.503 | 0.024*** |
| 12M | 37.097 | 4.535 | 0.534 |
Table R 23: Control group
| Duration | Mean (sec.) | SD | SE | 'a' |
| 0d | 31.902 | 4.726 | 0.557 | 5 ns |
| 2m | 31.93 | 4.856 | 0.572 | |
| 0d | 31.902 | 4.726 | 0.557 | 1.222 ns |
| 6m | 31.902 | 4.919 | 0.579 | |
| 0d | 31.902 | 4.726 | 0.557 | 2.28 ns |
| 12m | 31.972 | 4.91 | 0.578 | |
| 2m | 31.930 | 4.856 | 0.572 | 5 ns |
| 6m | 31.902 | 4.919 | 0.579 | |
| 2m | 31.930 | 4.856 | 0.572 | 2.777 ns |
| 12m | 31.972 | 4.91 | 0.578 | |
| 6m | 31.902 | 4.919 | 0.579 | 0.68 ns |
| 12m | 31.972 | 4.910 | 0.578 |
Table R 24: Inter-group comparison of EtC02 at different follow-up periods in control and experimental subjects.
| Group | Duration | Mean (sec.) | SD | SE | 't' |
| Experimental | 0D | 31.916 | 4.722 | 0.556 | 1 NS |
| Control | 0D | 31.902 | 4.726 | 0.557 | |
| Experimental | 2M | 33.402 | 4.461 | 0.525 | 8.323# |
| Control | 2M | 31.930 | 4.856 | 0.572 | |
| Experimental | 6M | 35.180 | 4.27 | 0.503 | 10.175## |
| Control | 6M | 31.902 | 4.919 | 0.579 | |
| Experimental | 12M | 37.097 | 4.535 | 0.534 | 11.039## |
| Control | 12M | 31.972 | 4.91 | 0.578 |
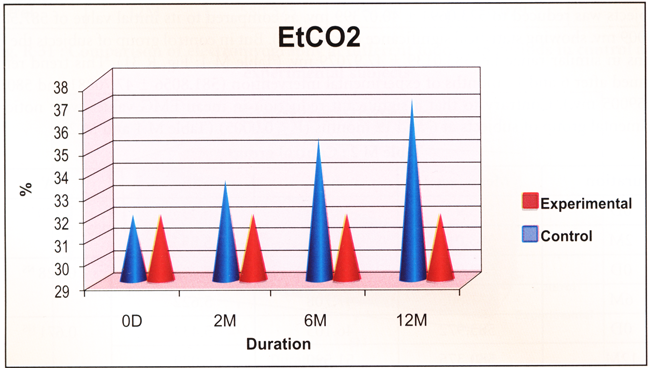
Inter group comparison of the mean values of EtCO, of experimental group with that of control group of subjects at 2, 6 and 12 months exhibited significant change with increase in value EtCO, of experimental group of subjects. (Table R 24; Fig. R 30).
Fig. R 30: Comparison of EtC02 at different follow-up periods in control and experimental subjects