 Prof. J.P.N. Mishra
At the onset of experiment, the mean value of QRS segment of experimental group of subjects was 0.0470 ± 0.0017sec, which increased insignificantly to 0.0471 ± 0.00174 sec after 2 months. At the same time, the mean values of control group of subjects were also increased but insignificantly and reached to 0.0468 ± 0.00192 sec. after 2 months which was 0.0469 +.00191 sec. at the onset of experiment (Table E 5).
Table E 5: Experimental group (n=100)
| Duration | Mean (sec.) | SD | SE | 'A' |
| 0D | 0.047 | 0.0017 | 0.0002 | 11.56NS |
| 2M | 0.047 | 0.0017 | 0.0002 | |
| 0D | 0.047 | 0.0017 | 0.0002 | 0.141*** |
| 6M | 0.046 | 0.0015 | 0.0001 | |
| 0D | 0.047 | 0.0017 | 0.0002 | 0.046*** |
| 12M | 0.045 | 0.0015 | 0.0001 | |
| 2M | 0.047 | 0.0017 | 0.0002 | 0.023*** |
| 6M | 0.046 | 0.0015 | 0.0001 | |
| 2M | 0.047 | 0.0017 | 0.0002 | 0.023*** |
| 12M | 0.045 | 0.0015 | 0.0001 | |
| 6M | 0.043 | 0.0015 | 0.0001 | 0.023*** |
| 12M | 0.045 | 0.0015 | 0.0001 |
Table 13 shows a continuous increase in the mean values of QRS segment in 2nd follow-up phase (6 months) in.-comparison to basal mean values in experimental group of subjects. Similar changes were noticed at 3rd follow-up schedule (12 months) and also when the values of different follow-up schedules were compared with each other in experimental group of subjects. But in control group of subjects no such changes were noticed at any follow-up stages (Table E 6).
Table E 6: Control group (n=100)
| Duration | Mean (sec.) | SD | SE | 'A' |
| 0D | 0.046 | 0.0019 | 0.0002 | 0.5 NS |
| 2M | 0.046 | 0.0019 | 0.0002 | |
| 0D | 0.046 | 0.0019 | 0.0002 | 1.25 NS |
| 6M | 0.046 | 0.0019 | 0.0002 | |
| 0D | 0.046 | 0.0019 | 0.0002 | 0.407 Ns |
| 12M | 0.046 | 0.0019 | 0.0002 | |
| 2M | 0.046 | 0.0019 | 0.0002 | 2.997 NS |
| 6M | 0.046 | 0.0019 | 0.0002 | |
| 2M | 0.046 | 0.0019 | 0.0002 | 1.002 NS |
| 12M | 0.046 | 0.0019 | 0.0002 | |
| 6M | 0.046 | 0.0019 | 0.0002 | 1.879 NS |
| 12M | 0.046 | 0.0019 | 0.0002 |
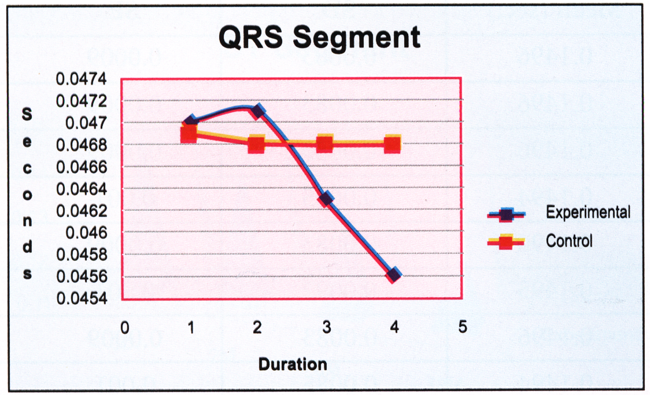
The mean values of both the groups at the onset of experiment were in similar range which showed homogeneity in both groups. A significant difference was observed only when mean values of control group were compared with that of experiment group after 12 months of intervention. The difference in values is shown in Table E 7 and Fig R 6.
Table E 7: Inter-group comparison of QRS segment at different follow-up periods in control and experimental subjects.
| Group | Duration | Mean (sec.) | SD | SE | 't' |
| Experimental | 0D | 0.047 | 0.0017 | 0.0002 | 0.349 NS |
| Control | 0D | 0.046 | 0.0019 | 0.0002 | |
| Experimental | 2M | 0.047 | 0.0017 | 0.0002 | 0.761 NS |
| Control | 2M | 0.046 | 0.0019 | 0.0002 | |
| Experimental | 6M | 0.046 | 0.0015 | 0.0001 | -1.422 NS |
| Control | 6M | 0.046 | 0.0019 | 0.0002 | |
| Experimental | 12M | 0.045 | 0.0015 | 0.0001 | -3.606# |
| Control | 12M | 0.046 | 0.0019 | 0.0002 |
Fig. R 6: Comparison of QRS segment at different follow-up periods in control and experimental subjects