 Prof. J.P.N. Mishra
The control group of subjects has shown almost constant level of SP02 during the different follow up periods, the mean values being 97.9444 ± 0.85397, 98.0139 ±.92680,99.2500 ±.91544 99.5278 ±.918851 %. Contrary to that there was a regular increase in the SP02 in experimental group of subject's at all follow-up periods. The mean SP02 level in this group on 0 day was estimated to be 97.9583 ±.84649 %. However, at the subsequent follow-up periods, i.e. 2, 6 and 12 months the mean values were 98.6667 ±.88811,99.2500 ±.91544 and 99.5278 ± 0.91885 % respectively. The difference in the mean values between control and experimental group of subjects at 6 and 12 months were statistically significant (p < 0.0005). (Table R 19 and R 20).
Table R 19: Experimental group
| Duration | Mean (sec.) | SD | SE | 'A' |
| 0D | 97.958 | .846 | .099 | 0.019*** |
| 2M | 98.666 | .888 | .104 | |
| 0D | 97.958 | .846 | .099 | 0.019*** |
| 6M | 99.25 | .915 | .107 | |
| 0D | 97.958 | .846 | .099 | 0.02*** |
| 12M | 99.527 | .918 | .108 | |
| 2M | 98.666 | .888 | .104 | 0.028*** |
| 6M | 99.25 | .915 | .107 | |
| 2M | 98.666 | .888 | .104 | 0.027*** |
| 12M | 99.527 | .918 | .108 | |
| 6M | 99.25 | .915 | .107 | 0.055*** |
| 12M | 99.527 | .918 | .108 |
Table R 20: Control group
| Duration | Mean (sec.) | SD | SE | 'A' |
| 0D | 97.944 | 0.853 | 0.1 | 0.555 NS |
| 2M | 98.013 | 0.926 | 0.109 | |
| 0D | 97.944 | 0.853 | 0.1 | 0.5 NS |
| 6M | 99.25 | 0.915 | 0.107 | |
| 0D | 97.944 | 0.853 | 0.1 | 1 NS |
| 12M | 99.527 | 0.918 | 0.1 | |
| 2M | 98.013 | 0.926 | 0.109 | 0.5 NS |
| 6M | 99.250 | 0.915 | 0.107 | |
| 2M | 98.013 | 0.926 | 0.109 | 0.555 NS |
| 12M | 99.527 | 0.918 | 0.108 | |
| 6M | 99.25 | 0.915 | 0.107 | 1 NS |
| 12M | 99.527 | 0.918 | 0.108 |
Table R 21: Inter-group comparison of SP02 at different follow-up periods 'in control and experimental subjects.
| Group | Duration | Mean (sec.) | SD | SE | 't' |
| Experimental | 0D | 97.958 | 0.846 | 0.099 | 1 NS |
| Control | 0D | 97.944 | 0.853 | 0.1 | |
| Experimental | 2M | 98.666 | 0.888 | 0.104 | 11.553# |
| Control | 2M | 98.013 | 0.926 | 0.109 | |
| Experimental | 6M | 99.25 | 0.915 | 0.107 | 11.165# |
| Control | 6M | 98.041 | 0.955 | 0.112 | |
| Experimental | 12M | 99.527 | 0.918 | 0.108 | 10.425# |
| Control | 12M | 98.055 | 0.977 | 0.115 |
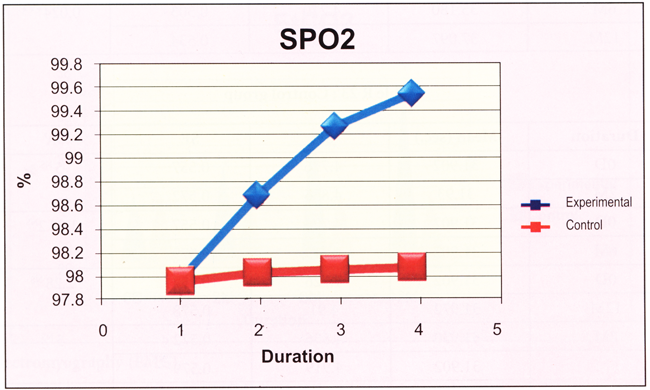
The values of SP02 of both the groups i.e. control and experimental group of subjects at the beginning of, the experiment were found to be in similar range (97.9444 ±.85397 and 97.9583 ±.84649 %) without any significant difference (Fig R 29). But after 2, 6 and 12 months a significant decline was noticed in experimental group, in comparison to control group, as depicted in Table R 21.
Fig. R 29: Comparison of SP02 at different follow-up periods in control and experimental subjects